SenseHub™ Poultry is an advanced monitoring solution developed by MSD Animal Health to enhance poultry farm management through real-time data collection and analysis. It utilizes wireless sensors to monitor key environmental and health parameters, providing actionable insights to improve bird performance, welfare, and overall farm productivity.
I own the design of this product, having taken on the responsibility of redesigning it to align with SenseHub’s brand guidelines while improcing the user experience of the interface.
As part of a redesign for the farm management platform, I was tasked with improving the usability and scalability of the dashboard’s navigation. The platform serves a diverse range of users, including farm managers, regional administrators, and operations personnel, each requiring tailored access to data and functionality.
Problem Statement
Navigational Challenges
Bad Structure
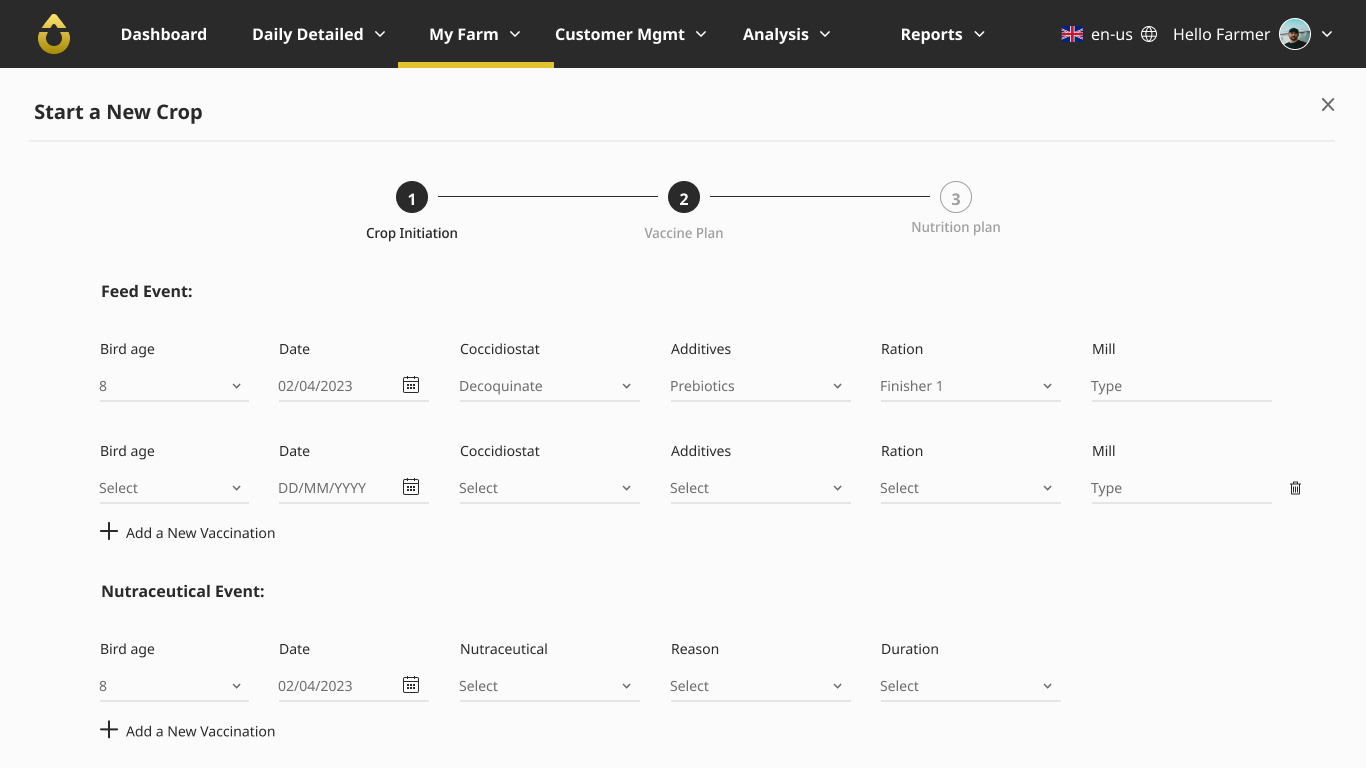
The existing navigation structure was overly complicated, with redundant pathways and unclear hierarchy. Users often struggled to locate key features, and permission-based access was inconsistently implemented. Related functions were scattered across different sections.
Disorientation
Once users selected a page from the dropdown menu, there was no persistent indicator or breadcrumb trail to show where they were in the system. This forced users to rely on memory.
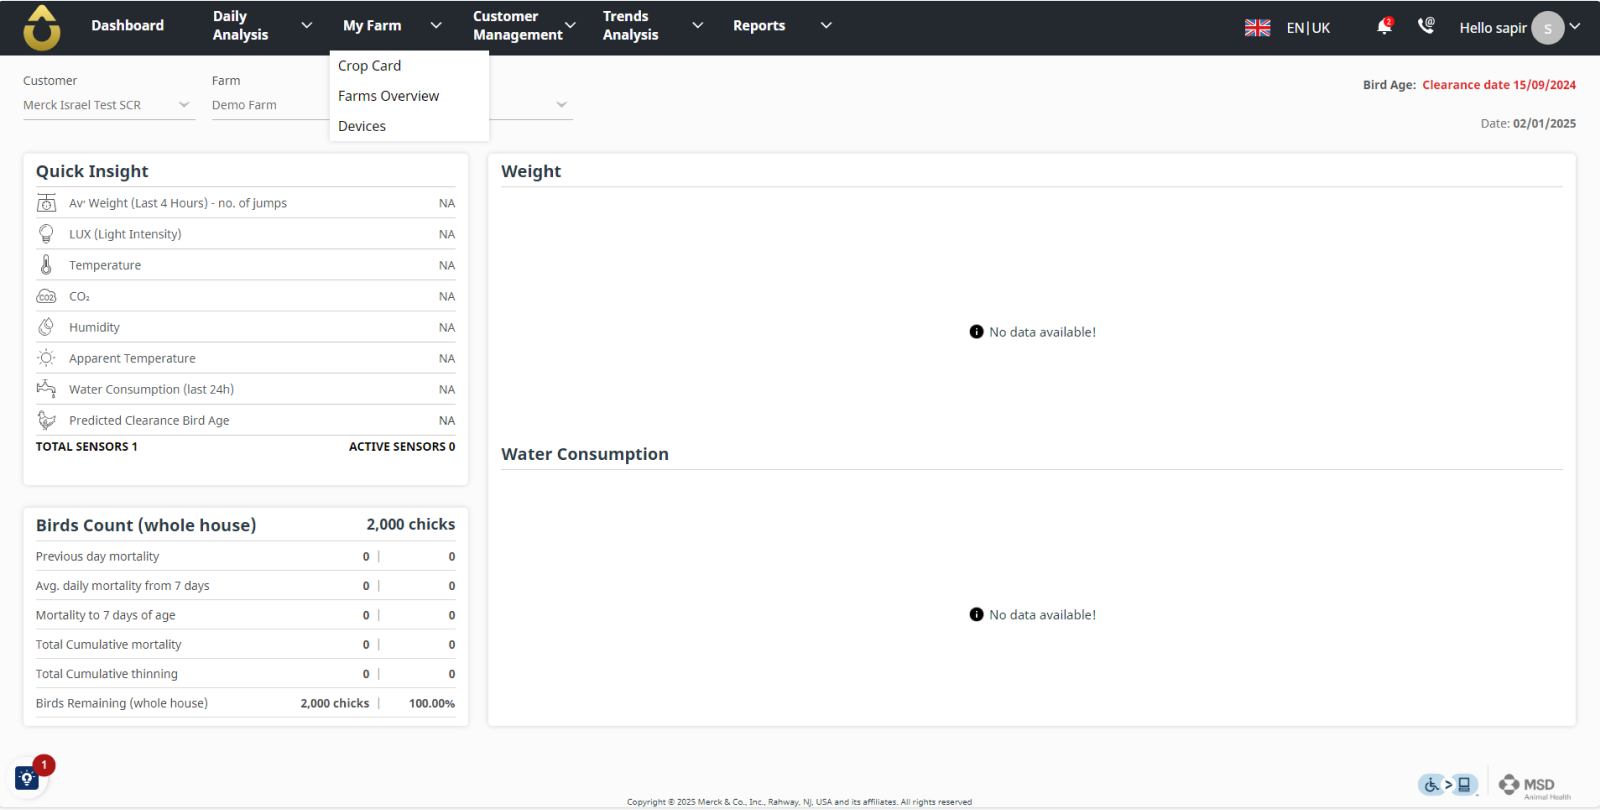
1.0 SenseHub Poultry’s old navigation bar
Insight
We needed to align the navigation with user roles and permissions and get rid of the hidden dropdown items
Step #1
The Process
Research and User Feedback
Mapping user journeys to identify frequent navigation bottlenecks, creating personas to understand pain points and workflows.
Information Architecture
Creating a new hierarchical structure based on user roles, clustering related functionalities under intuitive categories.
Wireframing and Conceptualization
Developing an initial sitemap addressing redundancy and defining role-based permissions.
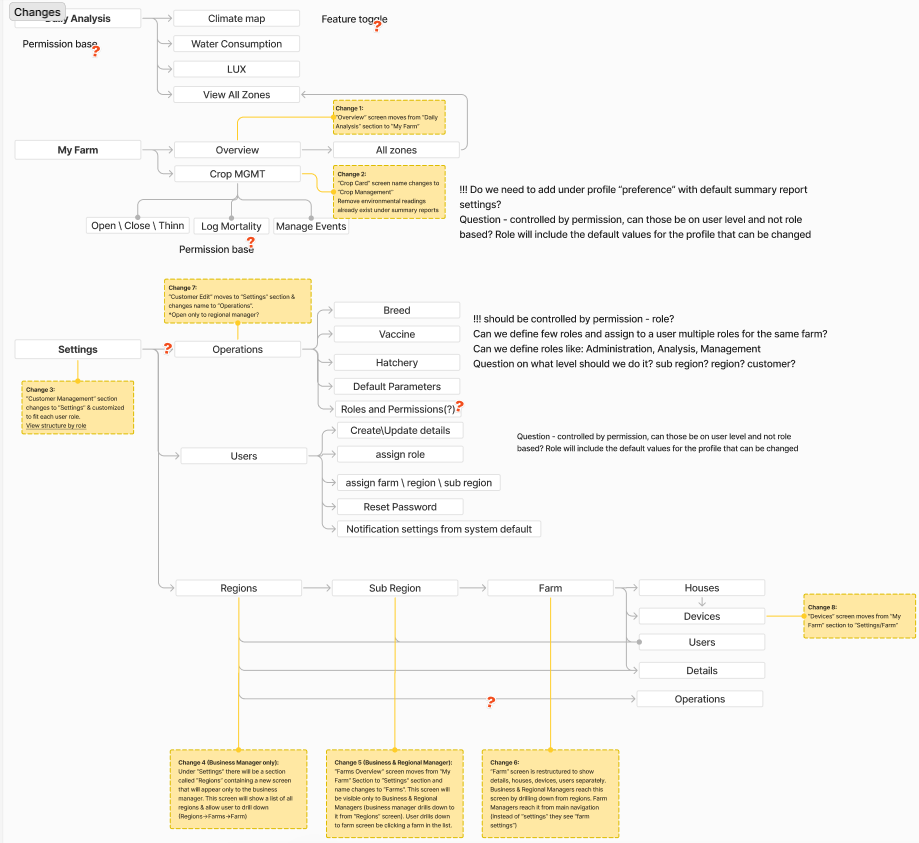
1.1 Showcase of the architecture map in Figjam
Step #2
Key Design Decisions
Breaking down the challenge
Permission-Based Navigation
Features are dynamically displayed based on user roles, enabling personalized dashboards.
Consolidated Operations
Unifing frequently accessed management tools under a single category, like settings.
Region-Based Customization
Allowing users to assign roles and view data by region, subregion or farm.
Step #3
Navigation Design Process
Two-tier structure
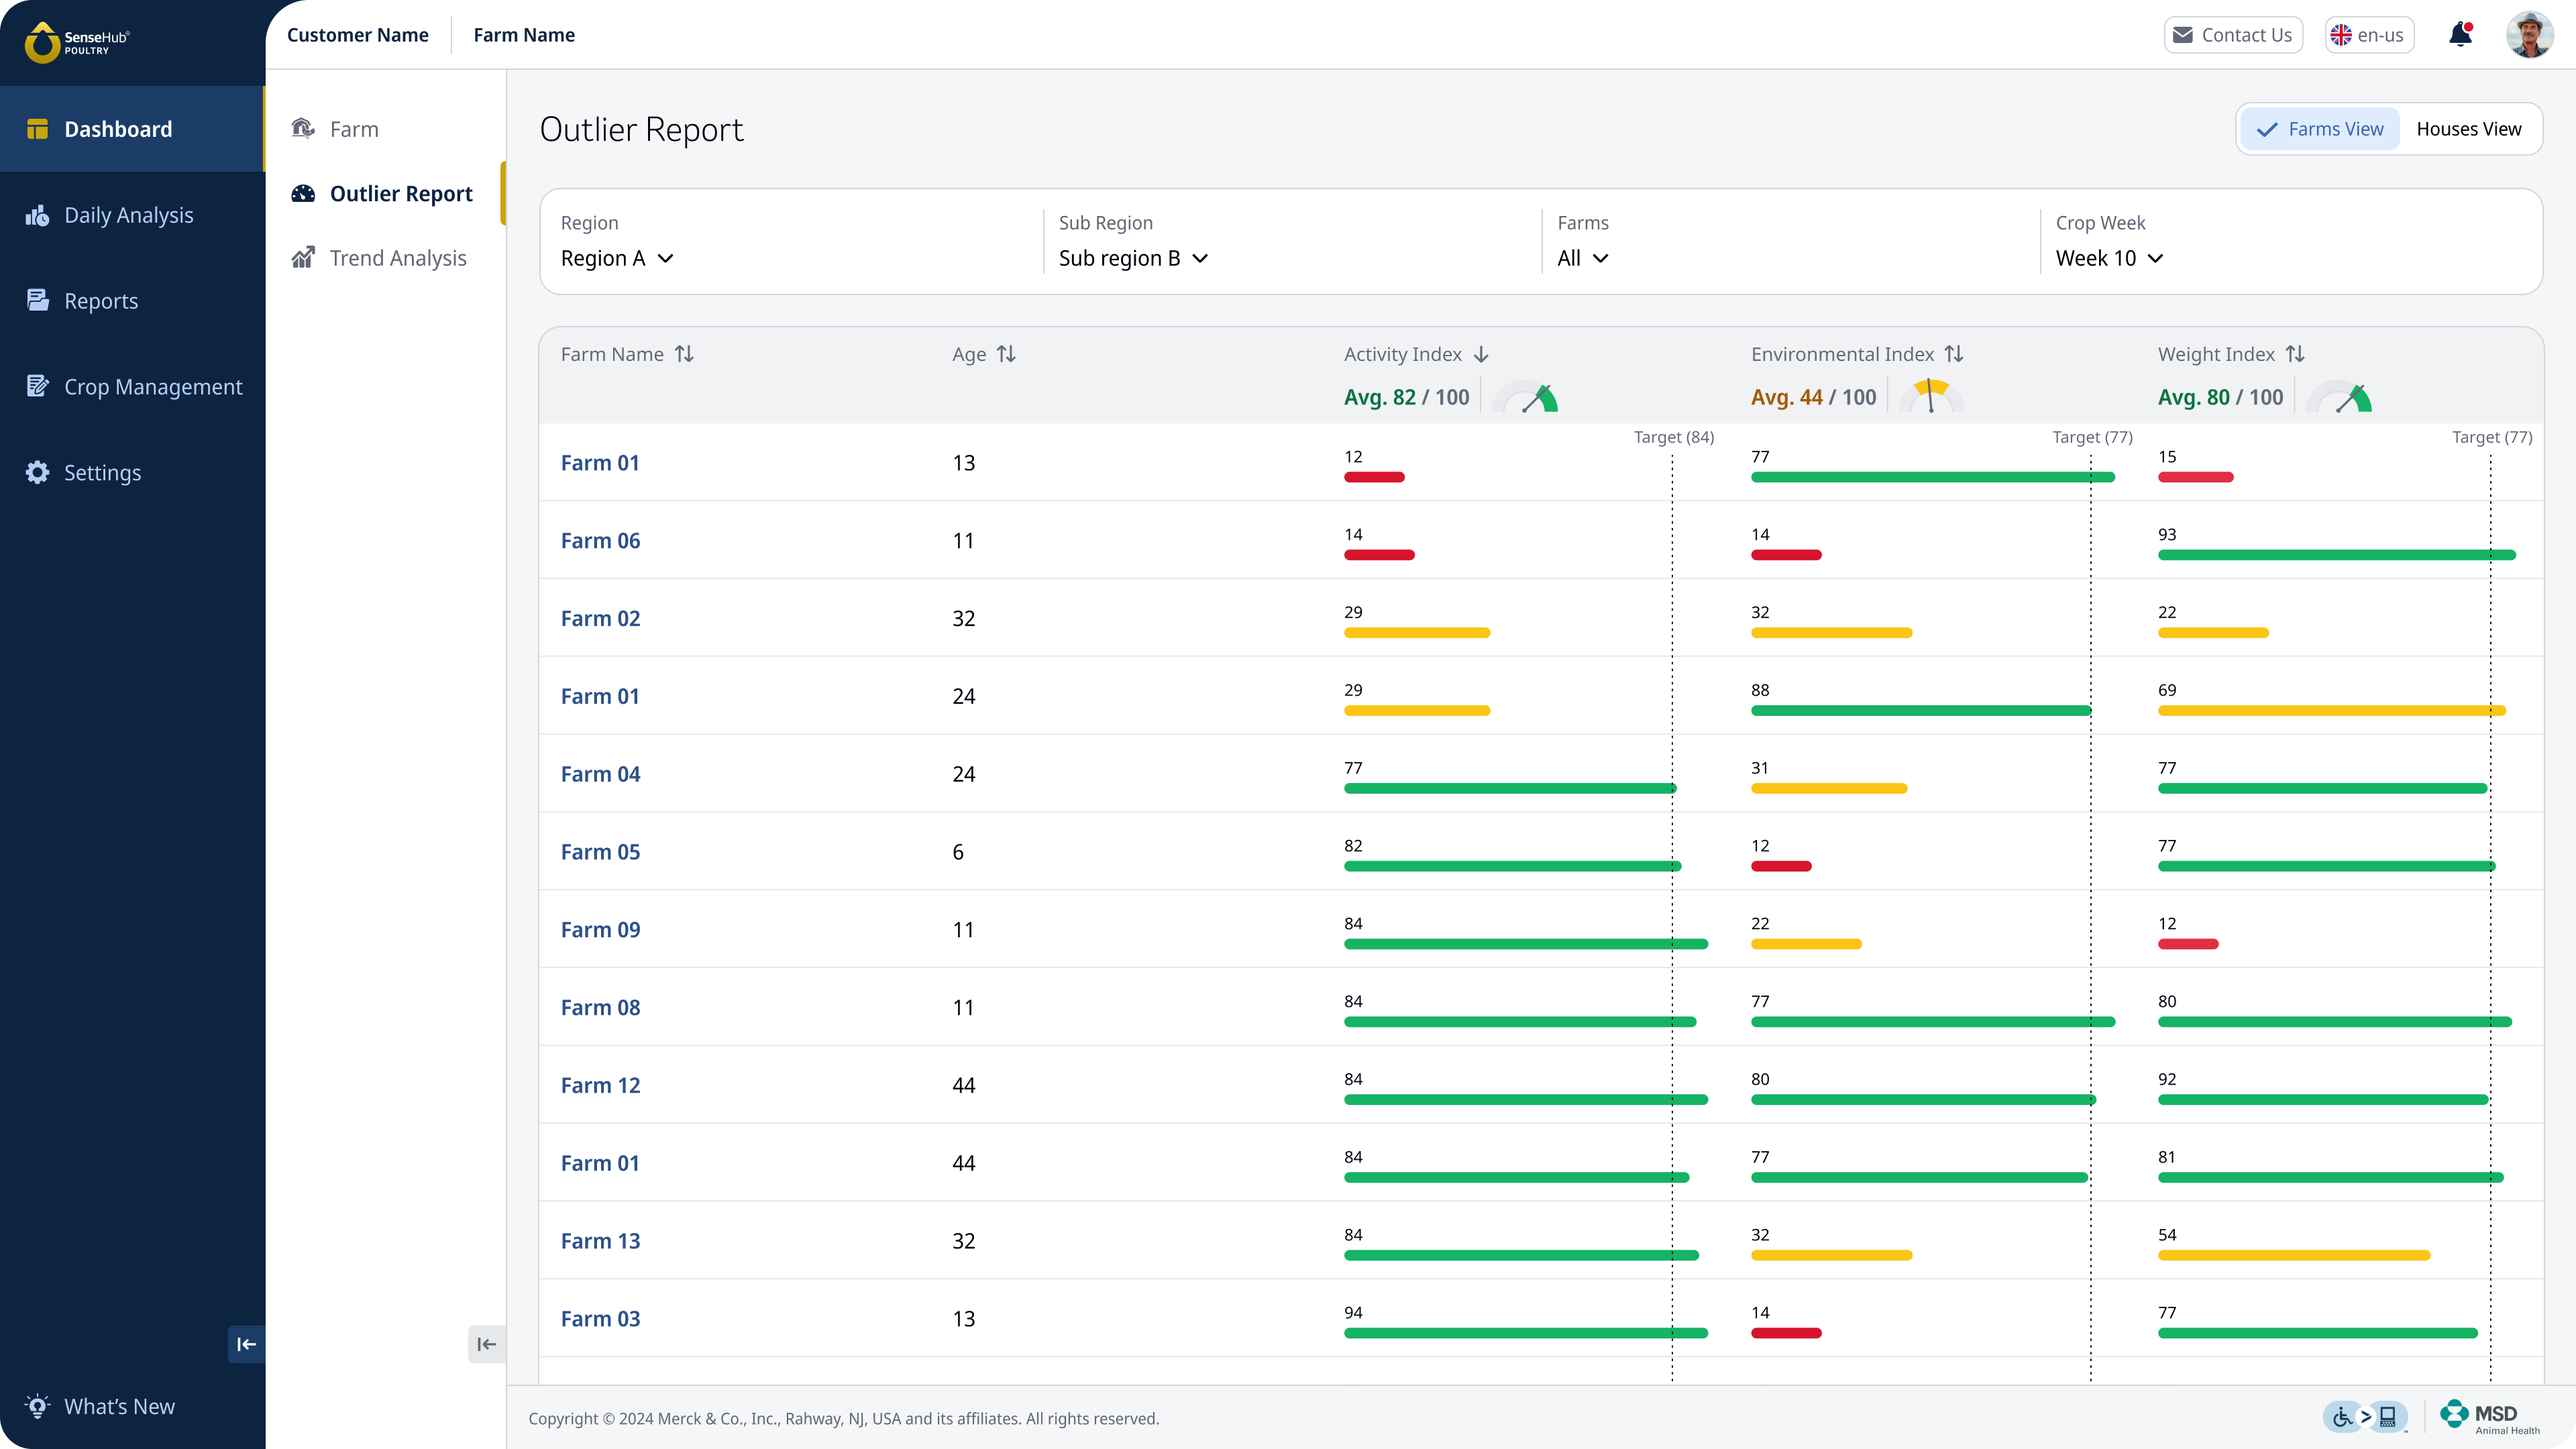
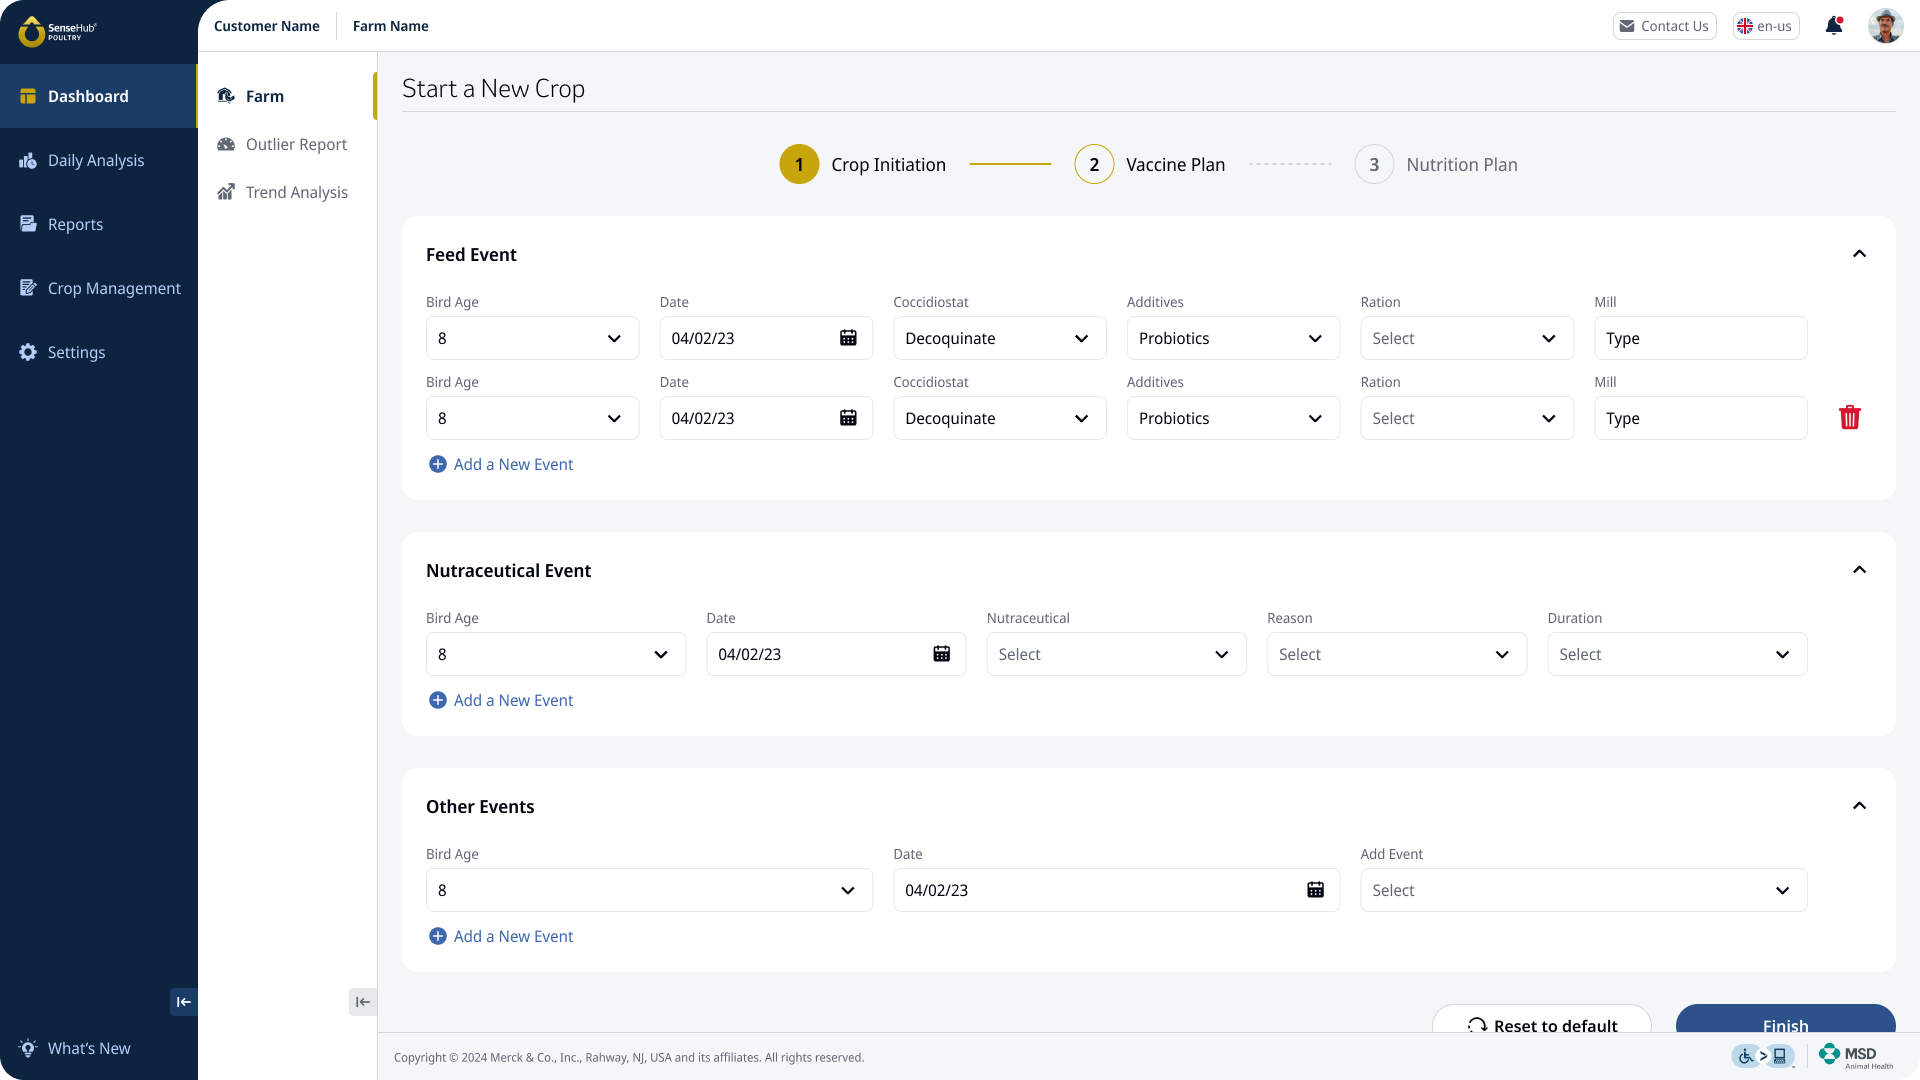
The redesign of the navigation system introduced a side navigation bar with a two-tier structure. The side navigation bar highlights the active primary and secondary sections, ensuring users always know where they are.
Scalability for Future Features
The side nav’s hierarchical structure can support future features like drill-downs and inner navigation.
Discoverability
The visible side nav exposes all primary features at a glance, improving discoverability and reducing the effort needed to locate functionalities.
Space Optimization
The new side navigation bar has an expand/collapse functionality which saves screen space and improves focus on content.
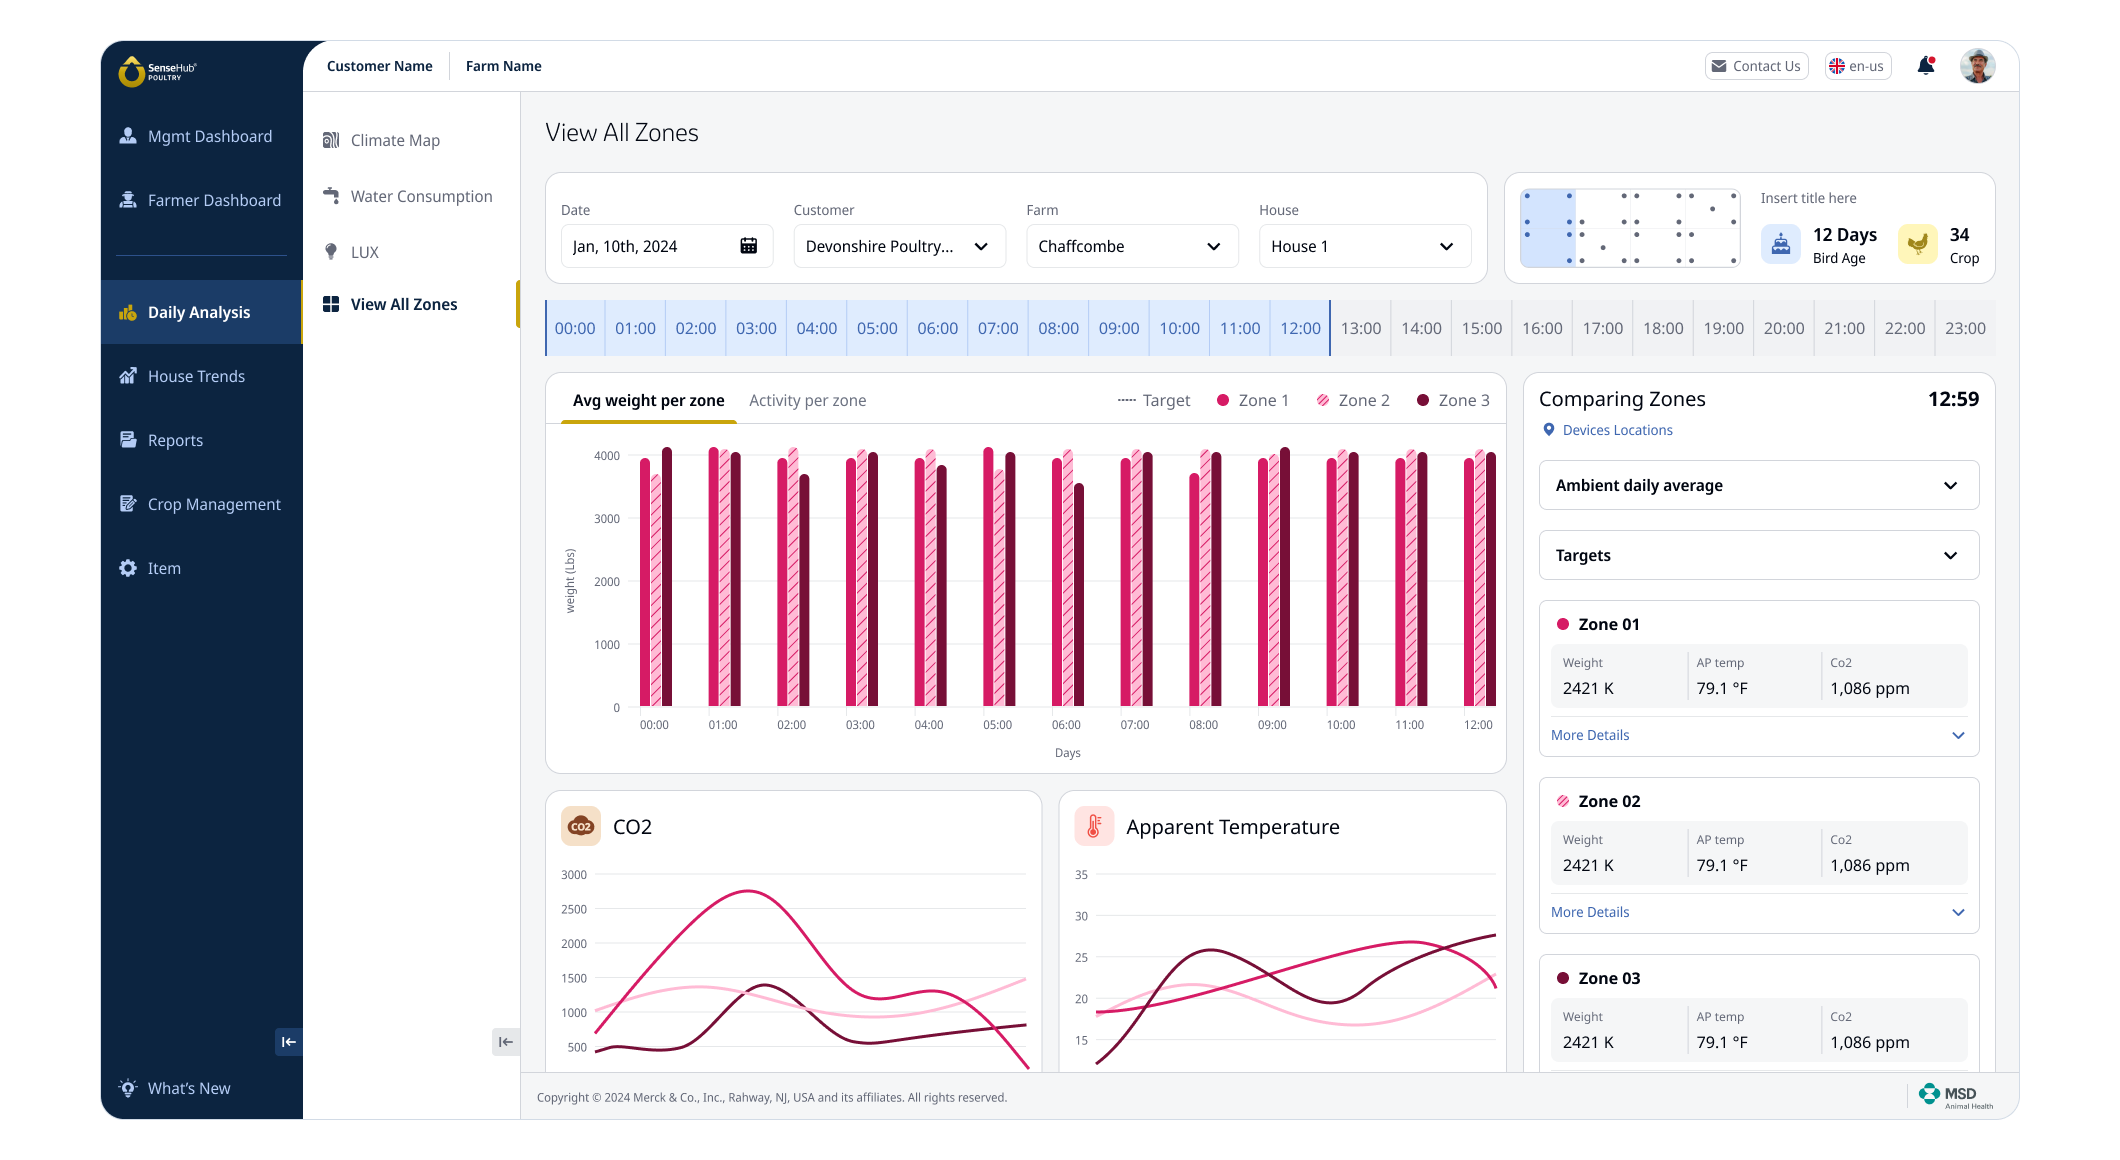
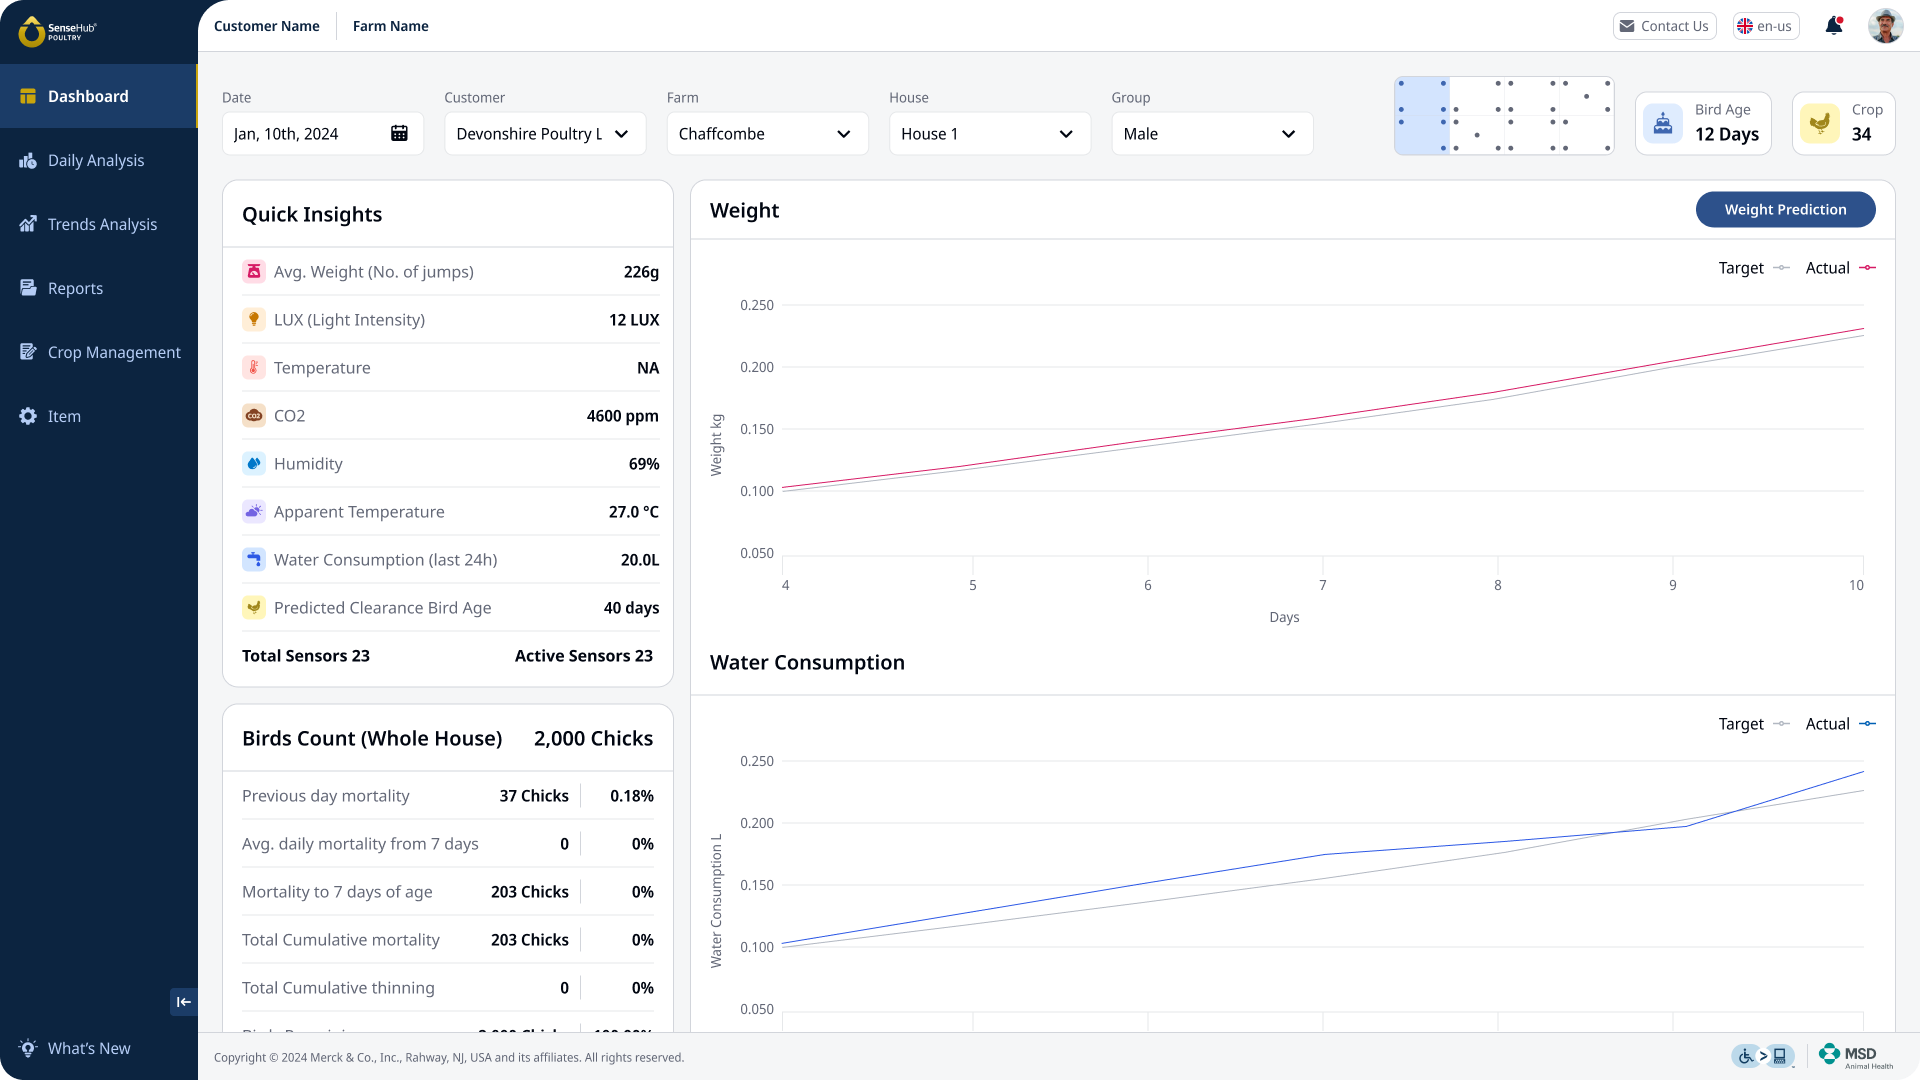
2.0 SenseHub Poultry’s new navigation – a showcase of the side bar behavior.
Step #4
Breakdown of the re-design process
Alignment with the SenseHub Brand
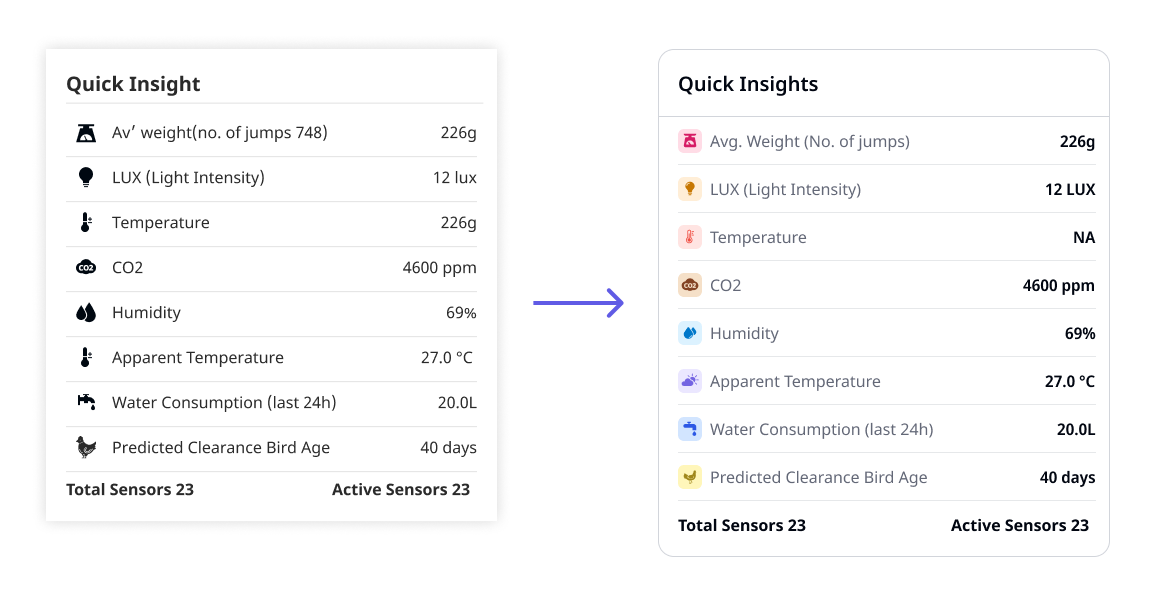
I wanted to achieve a more minimalist, clean, and modern interface that aligns better with SenseHub’s branding. The use of whitespace allowed a better focus on essential content reflect a professional and approachable look.
Layout and Structure Enhancements
The side navigation bar instead of the top navigation enhances user orientation. I preserved the clear content segmentation, but to improve the dense presentation of information I used visual design techniques to achieve a clear visual hierarchy, making it easier for the users to scan.
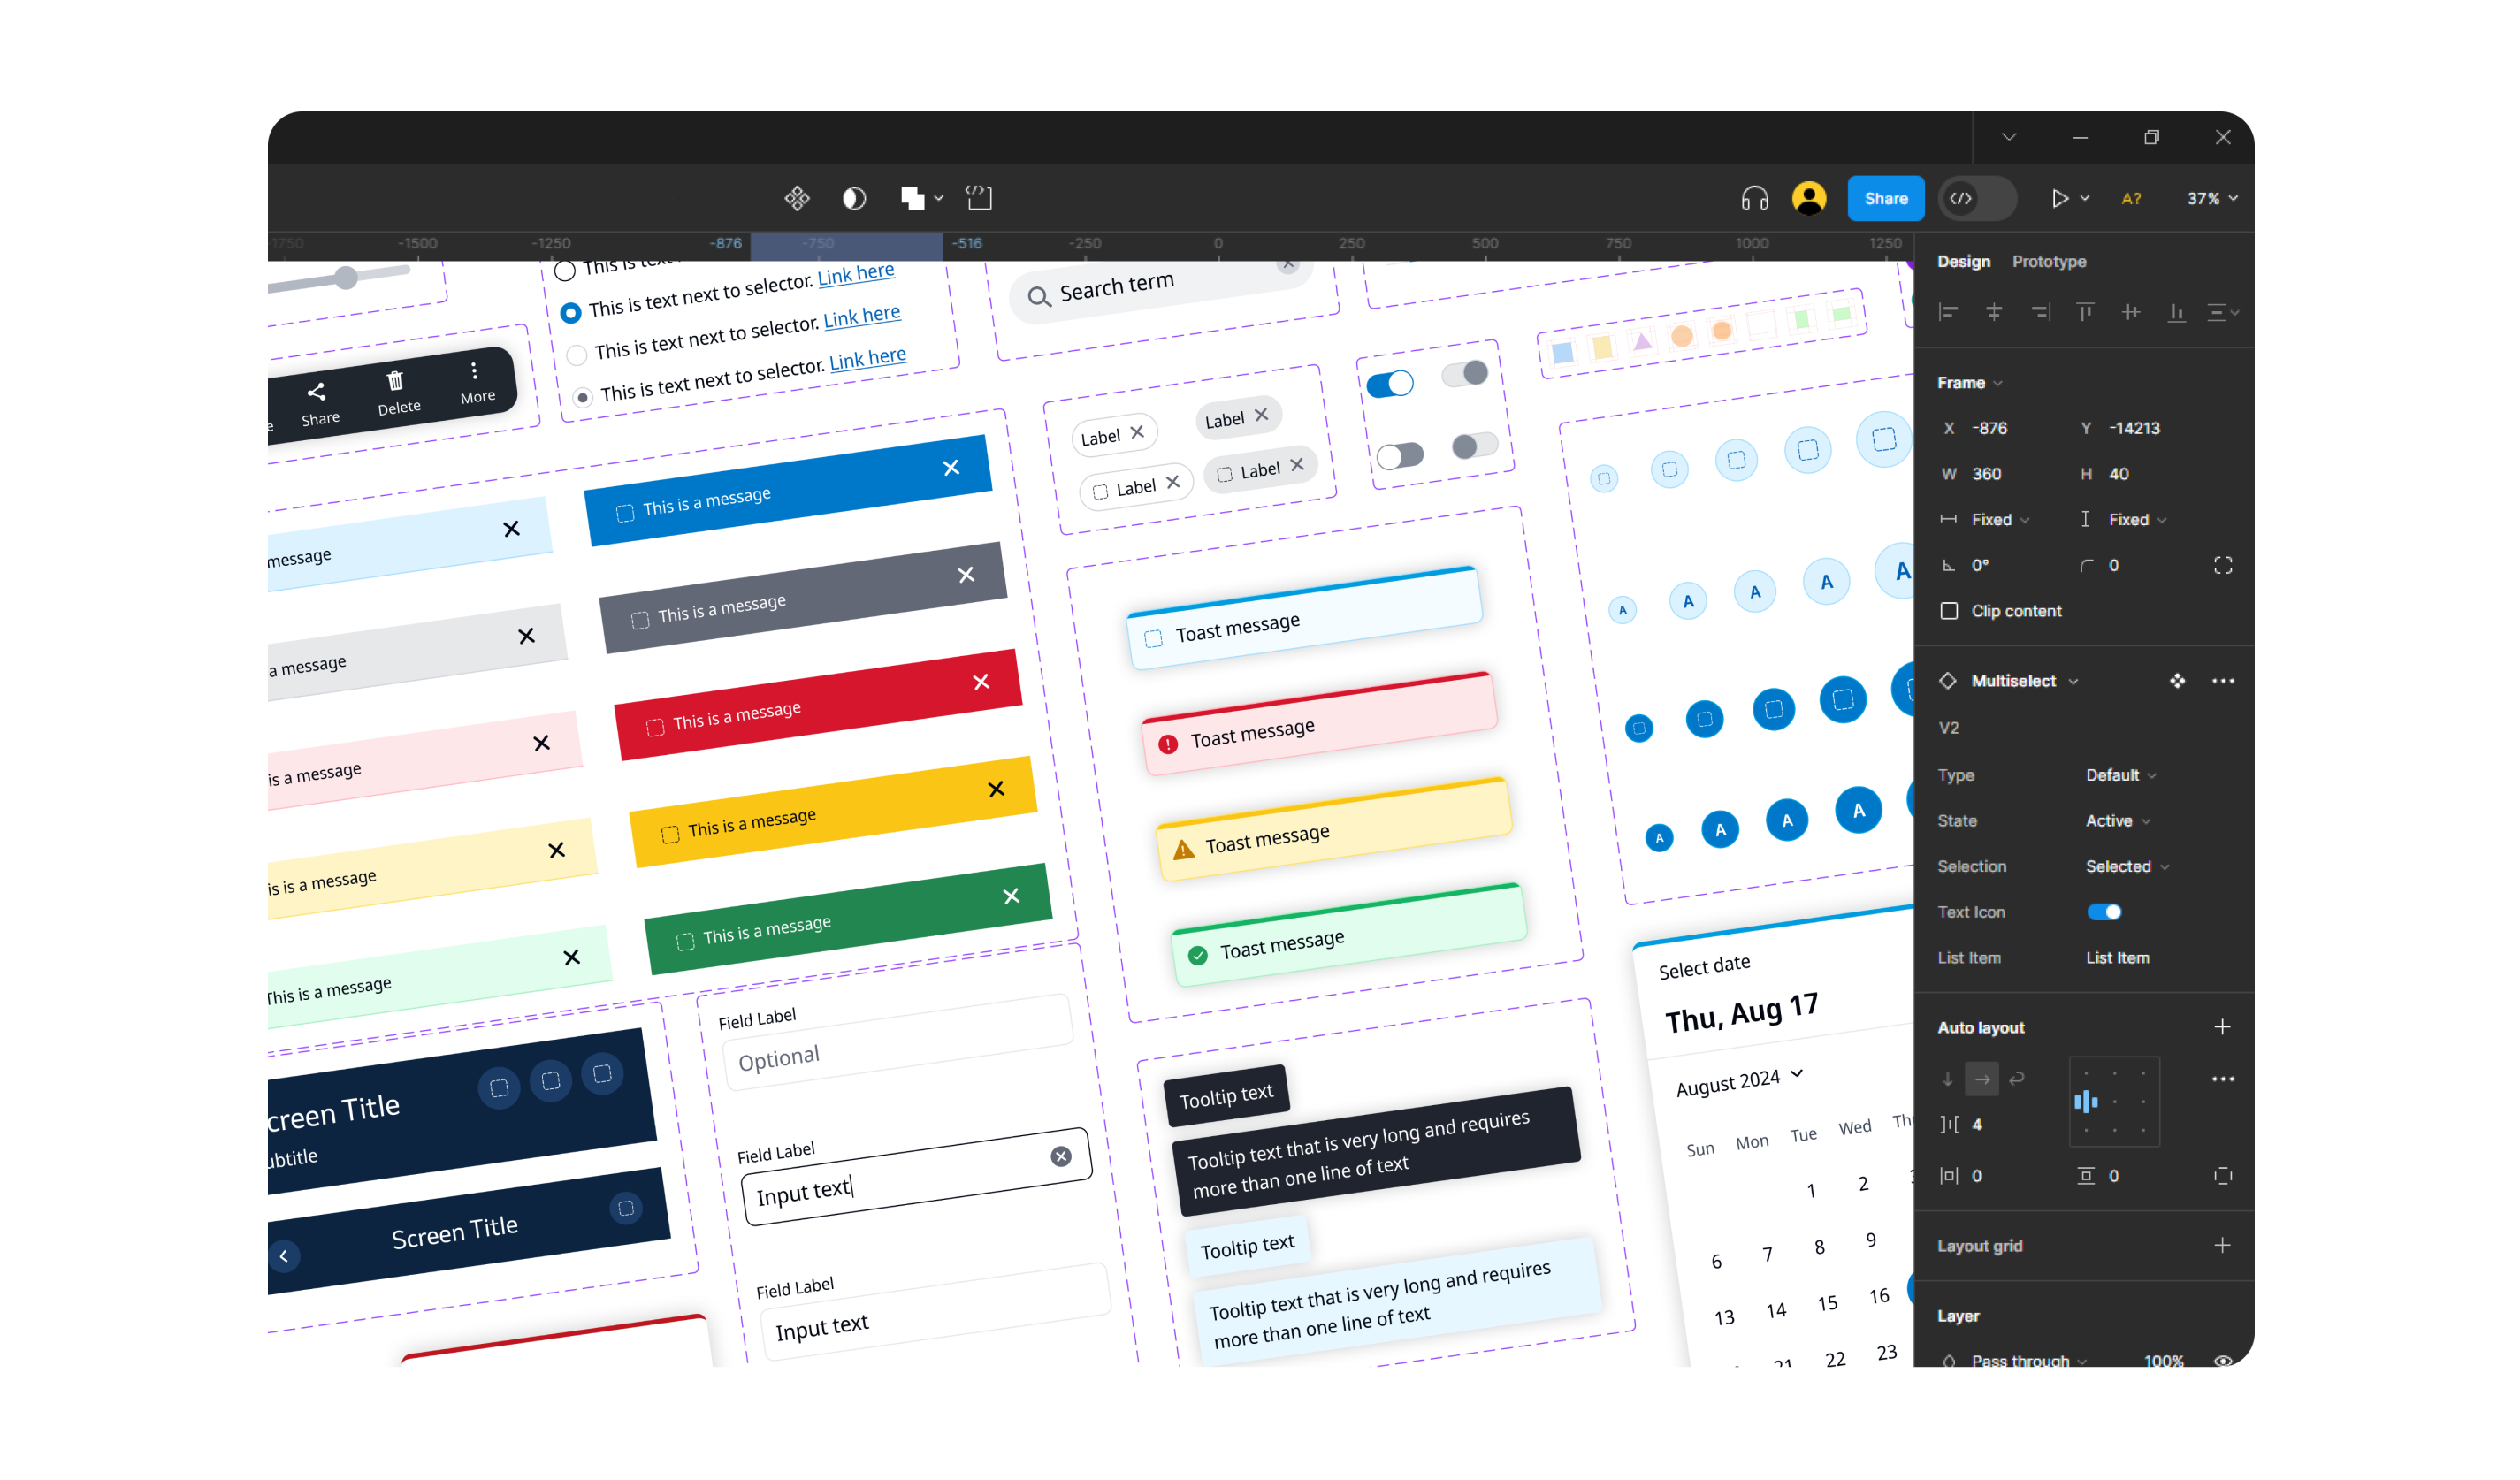
Visual Design Adjustments
I used the typography styles and text sizes from the design system, applied SenseHub’s brand colors, removed shadows and utilized contrast between light and dark shades to highlight key information.
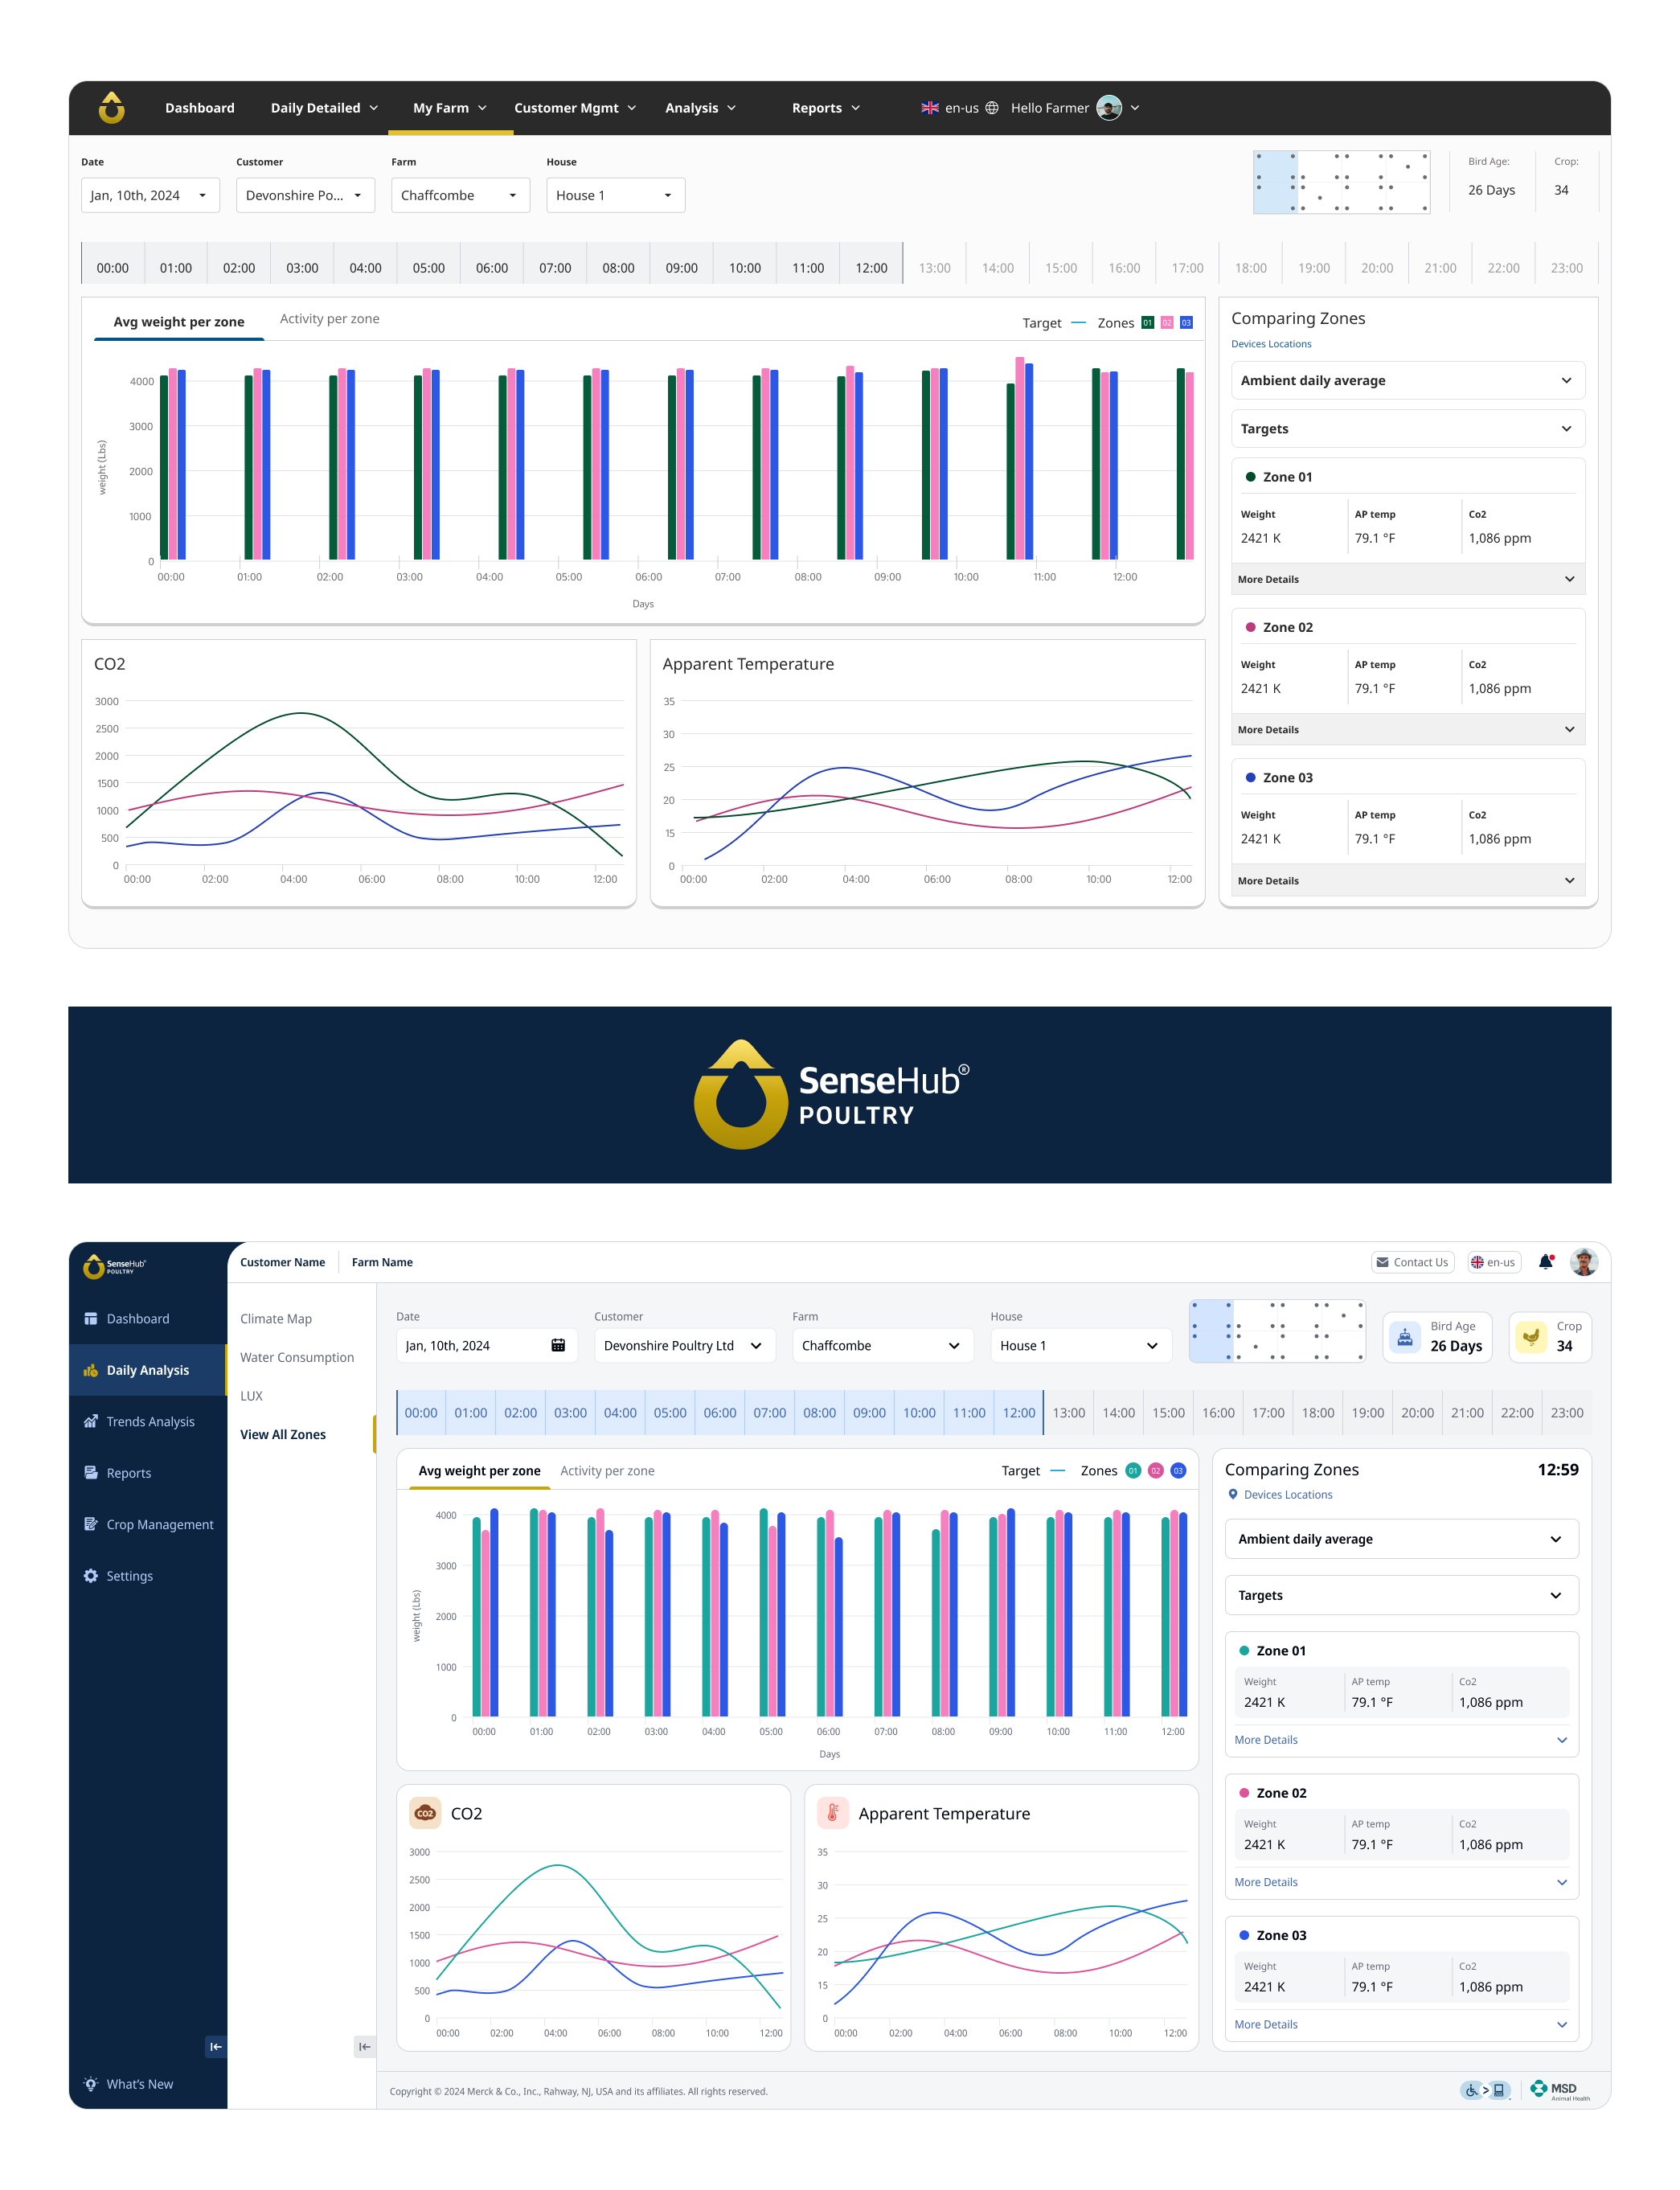
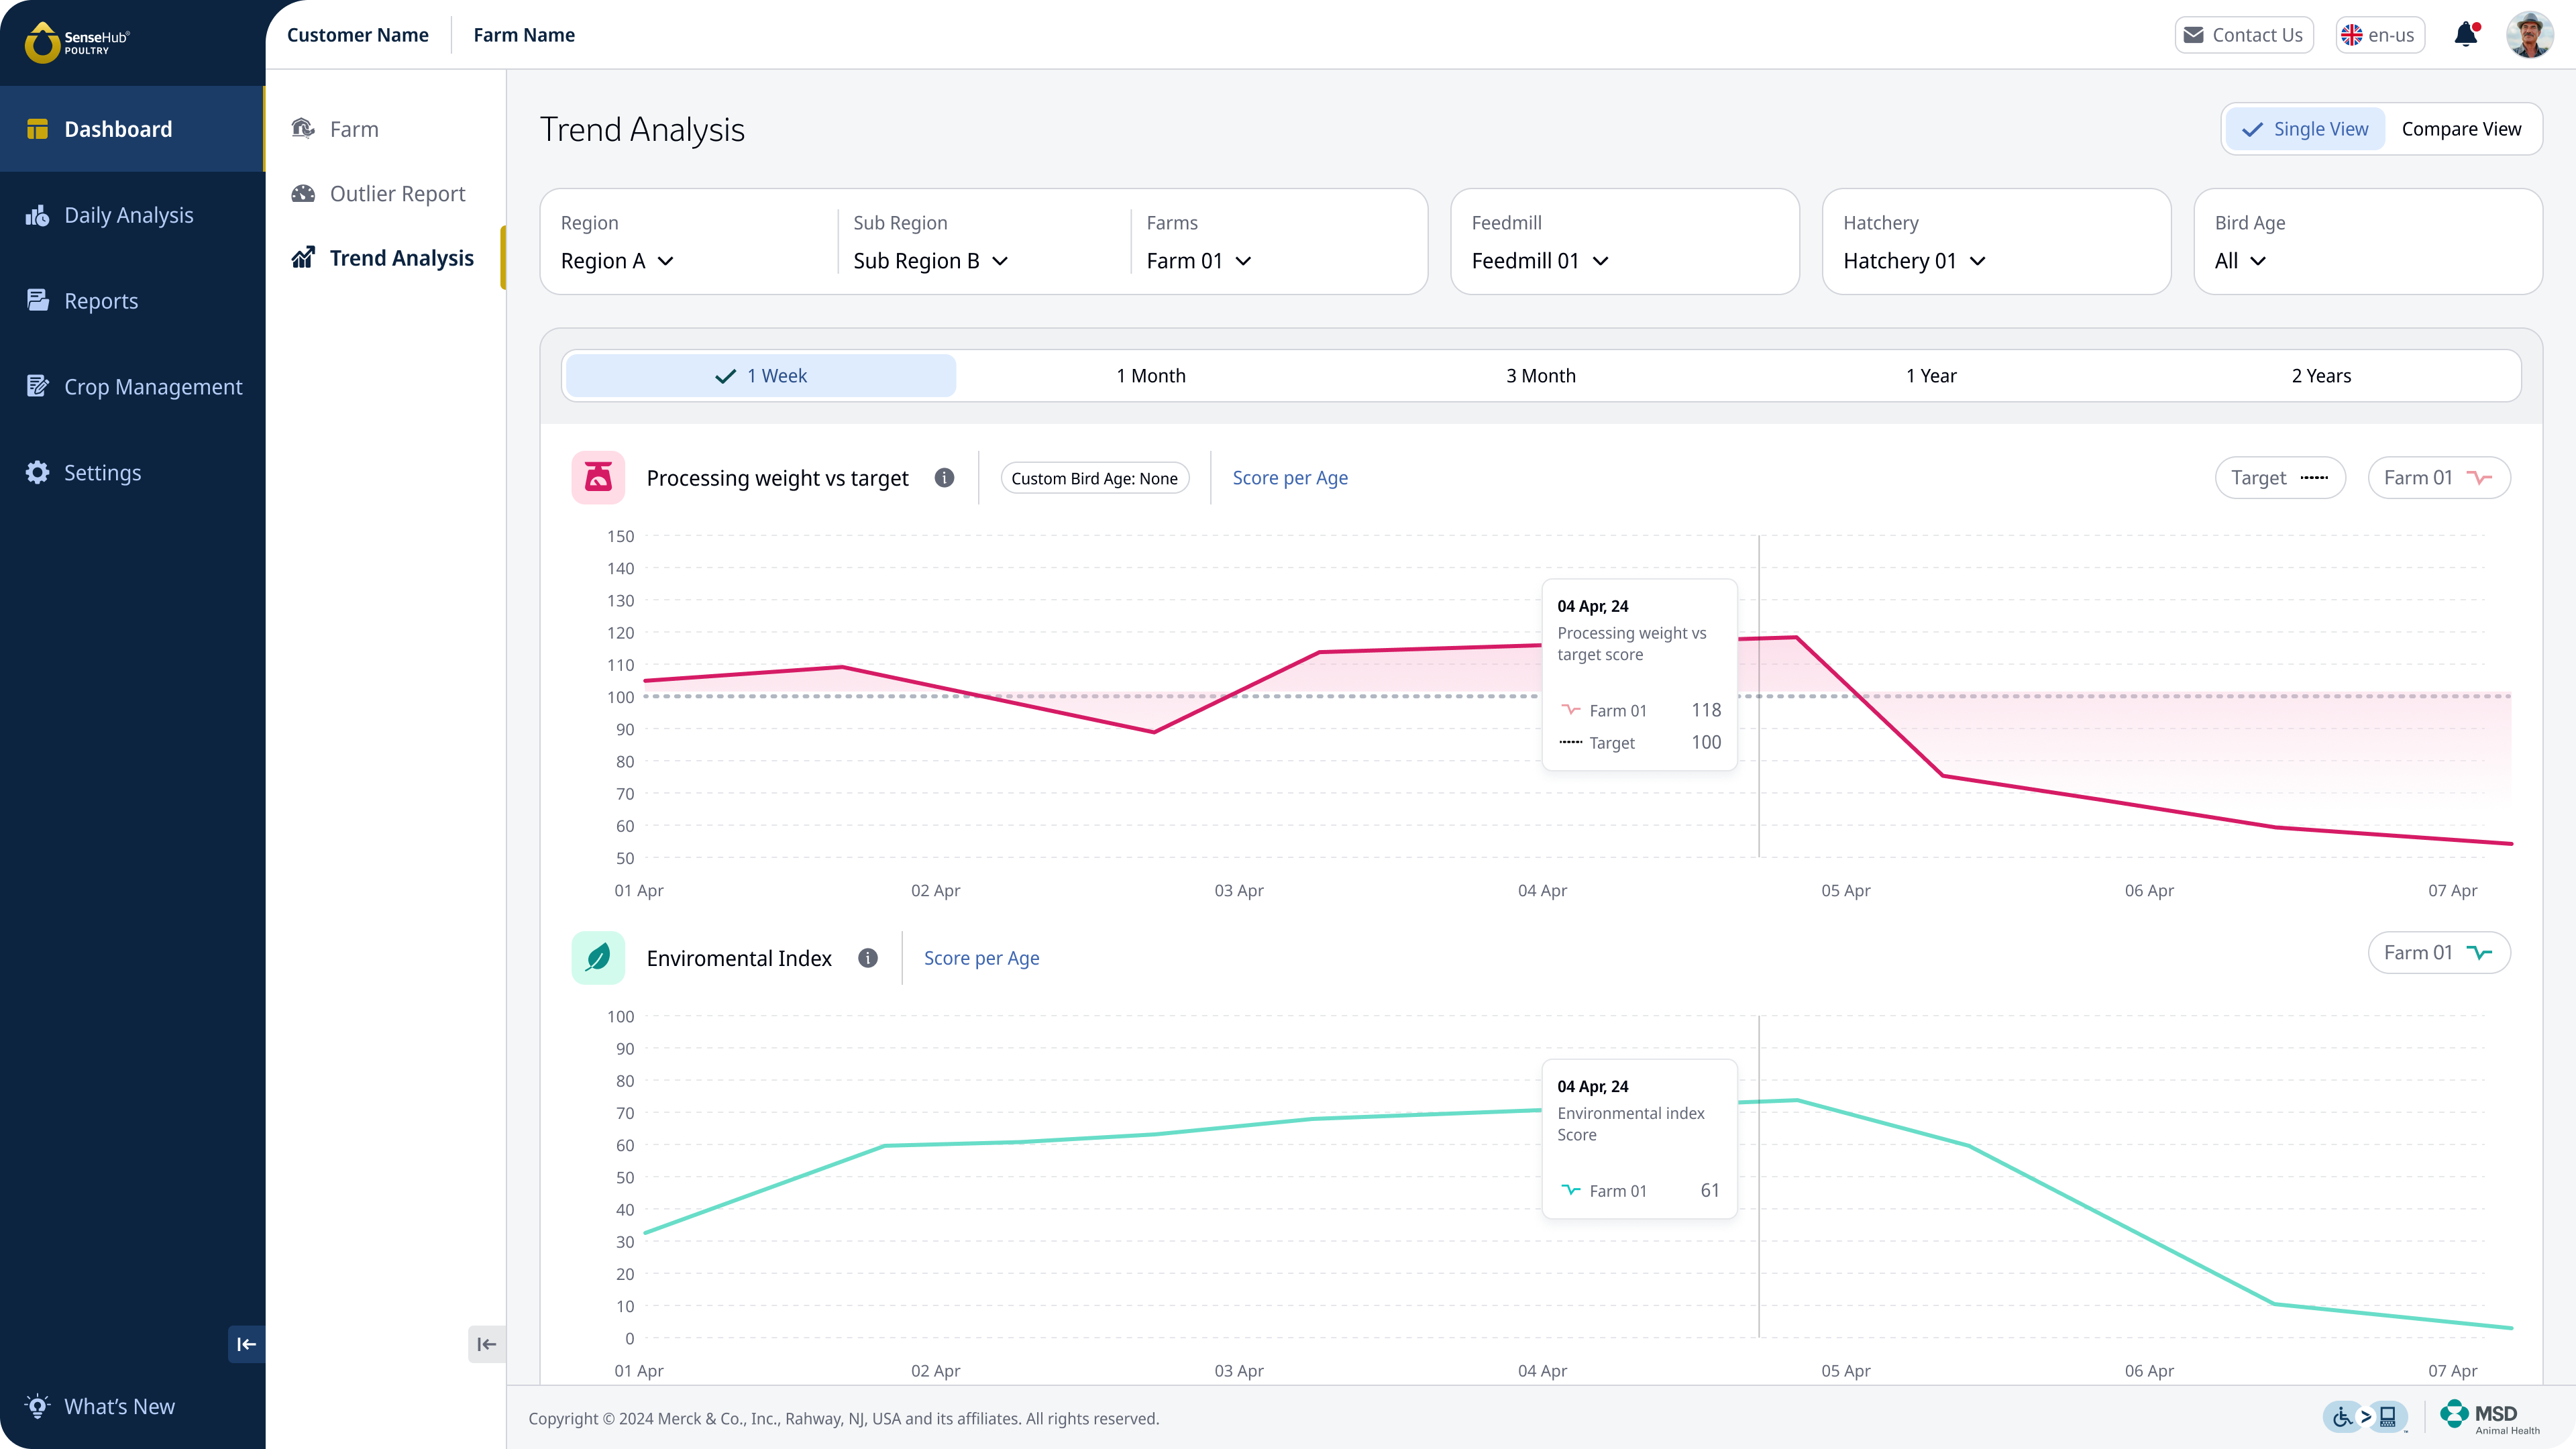
Roles assignment through color
The system relied solely on icons to represent different measurements, which users found difficult to distinguish through the graph colors. To improve recognition, I assigned a distinct color to each ‘role’, enabling users to identify them quickly and easily.
2.1 Assigning a color for each role that would classify its measurement made it easier to recognize the graphs colors fast.
2.2 A showcase of graphs using roles classifier colors
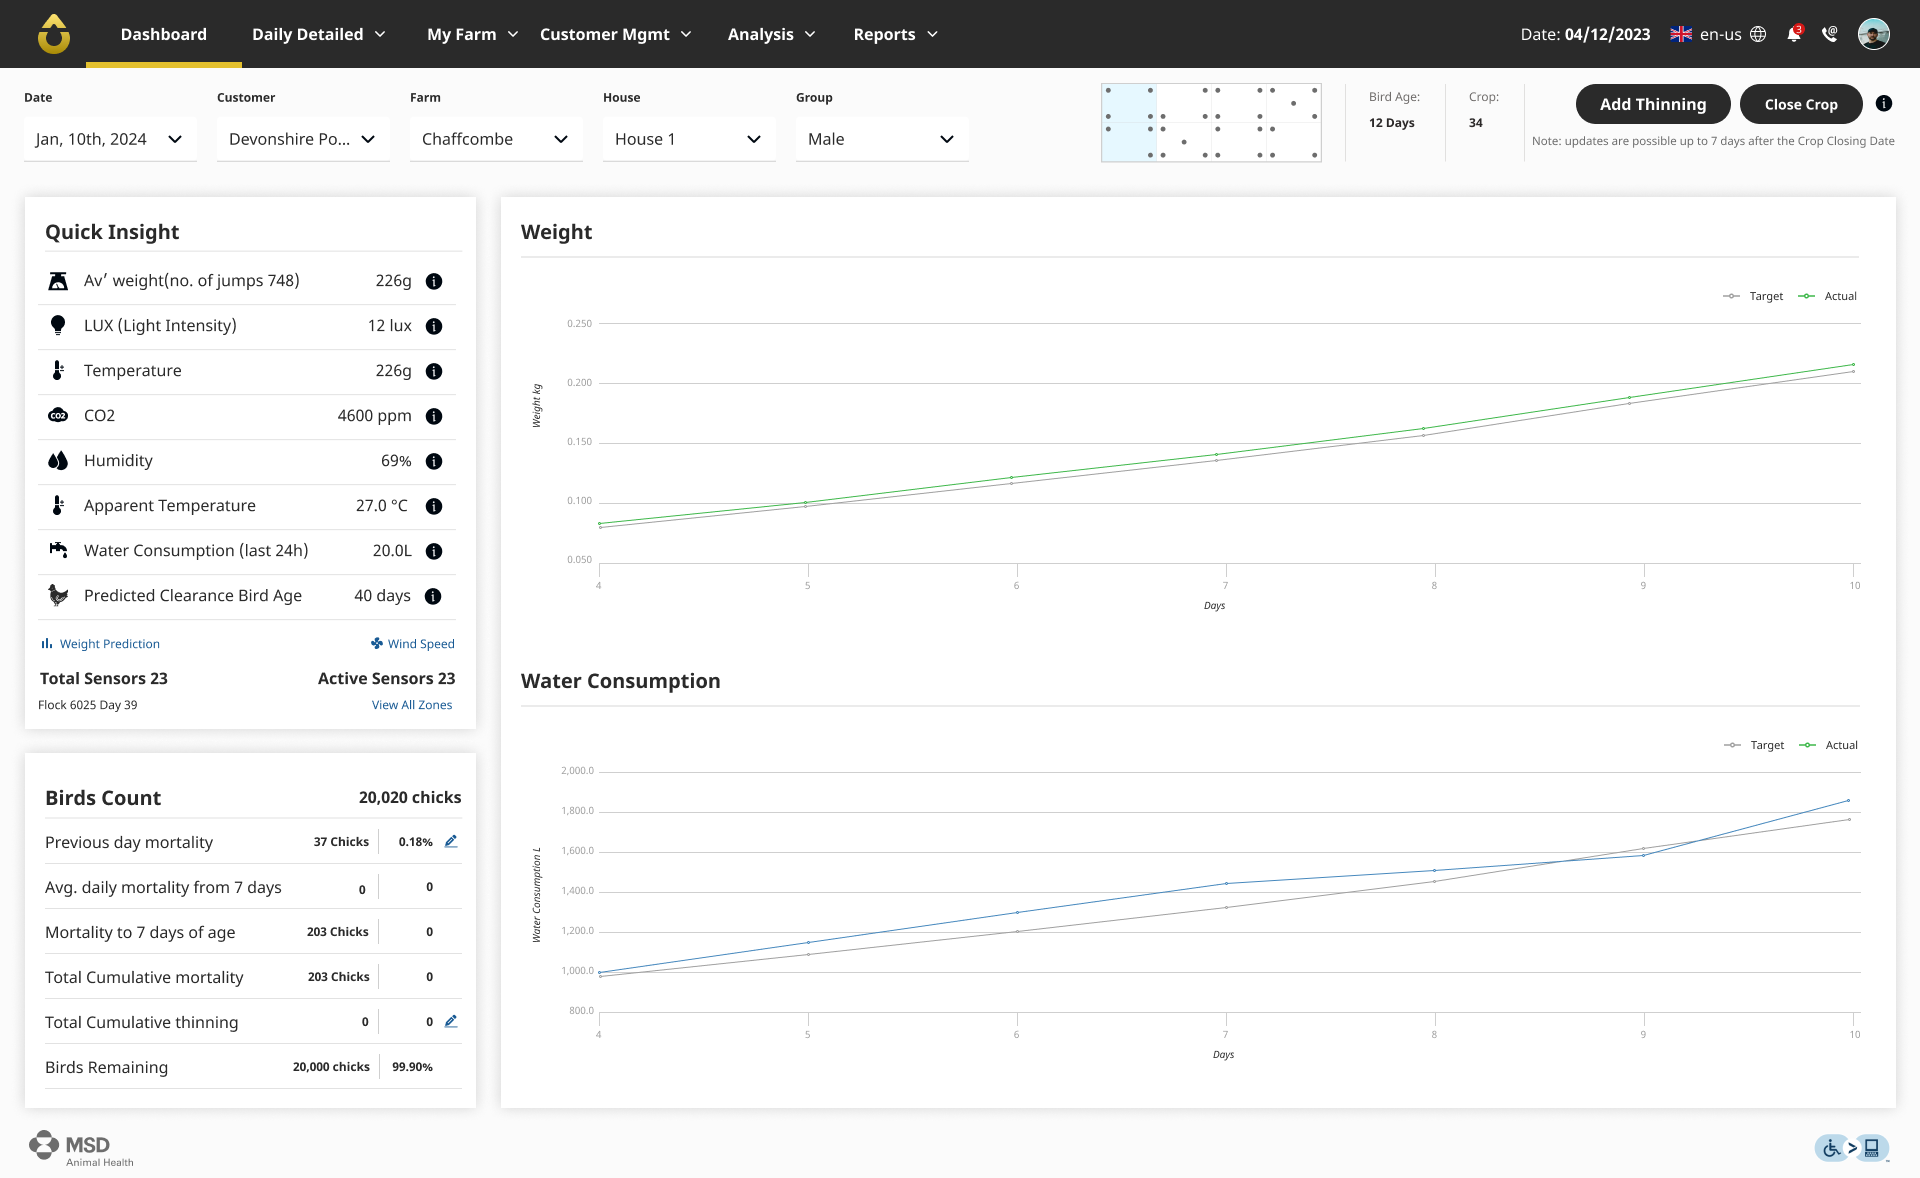
Old Design
New Design
Edit Template
Edit Template
Old Design
New Design
Edit Template
Edit Template
This case study is a work in progress and will be continuously updated.
Next project:
SenseHub Design System (MSD)
Establishment of a design system and design concept for product lines
SenseHub Design System (MSD)
Establishment of a design system and design concept for product lines